

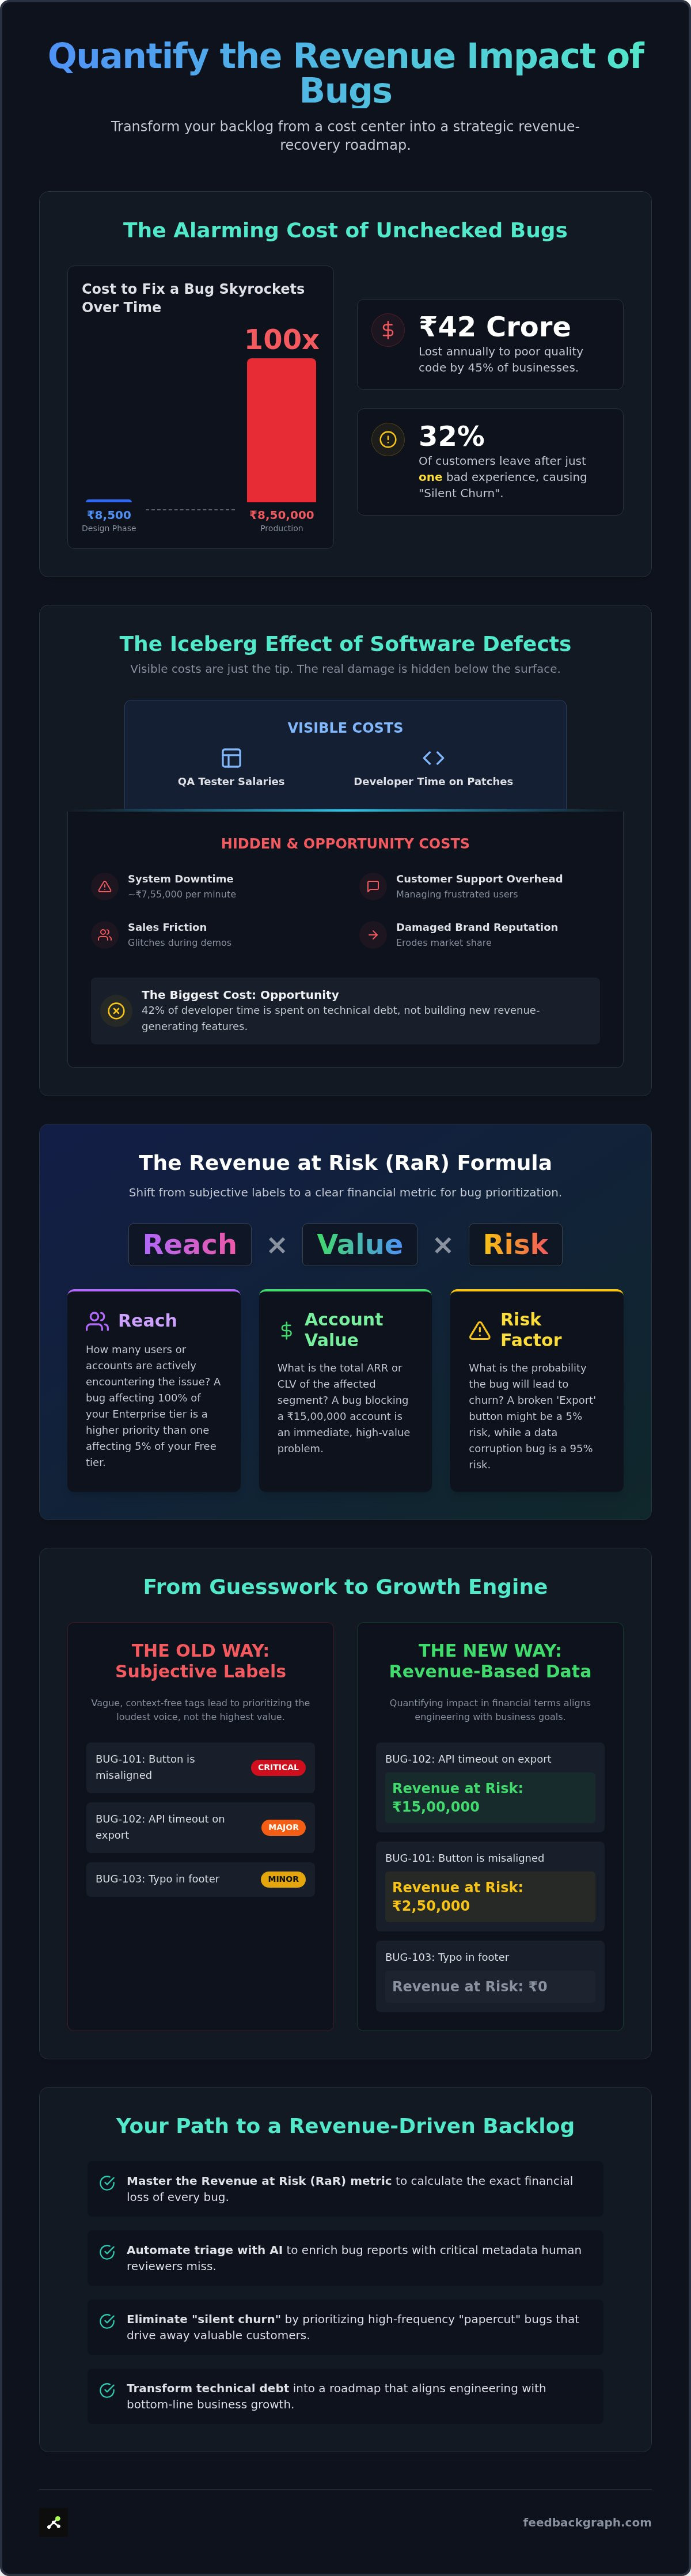
A software bug discovered in production costs 100 times more to resolve than one identified during the design phase, contributing to the ₹42 crore that 45% of businesses lose annually to poor quality code. You've likely seen engineering resources evaporate on low-impact edge cases while "papercut" bugs drive your churn rates higher. It's nearly impossible to defend technical debt to stakeholders when you can't quantify revenue impact of bugs in clear financial terms. This lack of visibility turns your backlog into a graveyard of missed opportunities rather than a strategic asset.
You need a triage process that replaces subjective labels with hard profit-and-loss data. This guide delivers the exact formulas and automated workflows required to transform your backlog into a quantifiable revenue-recovery roadmap. We will break down how to automate your triage using AI, integrate customer feedback directly into your development lifecycle, and ensure every engineering hour contributes to measurable business growth.
Key Takeaways
- Master the Revenue at Risk (RaR) metric to calculate the exact financial loss of every bug in your backlog based on reach and account value.
- Discover the proven workflow to quantify revenue impact of bugs by mapping reporter account tiers and ARR directly to engineering tickets.
- Automate the triage process using AI to enrich bug reports with critical metadata that human reviewers often overlook.
- Identify and eliminate "silent churn" by prioritising the high-frequency "papercut" bugs that drive away your most valuable customers.
- Transform your technical debt into a strategic revenue-recovery roadmap that aligns engineering output with bottom-line business growth.
The Hidden Cost of Silence: Why Bug Impact is Measured in Dollars, Not Tickets
Engineering teams often view bugs as a drain on velocity. They measure impact by story points, developer hours, or sprint capacity. This perspective is dangerously narrow. To effectively quantify revenue impact of bugs, you must look beyond the Jira ticket and into your profit and loss statement. Every defect in production is a financial leak that directly affects your bottom line.
The urgency has never been higher. By 2026, the cost of a bug found in production is 100 times higher than one caught during design. What would cost ₹8,500 to fix early can balloon to ₹8,50,000 once it hits your users. Product teams can no longer afford to treat technical debt as a secondary concern. It's a primary driver of "Silent Churn." Research indicates that 32% of customers will abandon a brand after just one bad experience. Most of these users won't complain or file a support ticket. They simply leave. This unrecorded churn represents a massive, invisible erosion of your Annual Recurring Revenue (ARR).
The Iceberg Effect of Software Defects
Visible costs represent only the tip of the iceberg. You can easily track salaries for QA testers and developer time spent on patches. However, the economic impact of software bugs creates a ripple effect across your entire organisation. When a system fails, the average cost of downtime reaches approximately ₹7,55,000 per minute. These figures don't account for the Customer Success overhead required to manage frustrated users or the sales friction created when prospects encounter glitches during a demo. These hidden costs erode your market share and damage long-term brand reputation, making it harder to close high-value deals in a competitive landscape.
Opportunity Cost: What Are You NOT Building?
The most significant cost of a bug is the feature you didn't ship because your team was busy patching holes. Developers currently spend about 42% of their time on technical debt and maintenance. This is a massive waste of high-value engineering talent. Without a way to quantify revenue impact of bugs, teams fall into the trap of "loudest customer" prioritisation. They fix what the angriest user shouts about, regardless of that user's actual contract value.
Stop guessing. Aligning your technical debt management with revenue based product prioritization ensures your team works on what matters. If a bug threatens a ₹15,00,000 enterprise account, it must take precedence over a minor UI tweak requested by a low-tier user. Shifting to a revenue-centric culture allows you to justify engineering decisions in the only language stakeholders truly value: growth and retention.
The Revenue Impact Formula: How to Calculate Lost Value per Bug
Most engineering teams rely on subjective severity tags like "Critical" or "Major." These labels are functionally useless for business leaders because they lack financial context. A "Critical" UI bug on a legacy feature might be less dangerous than a "Minor" glitch in your checkout flow. To effectively quantify revenue impact of bugs, you need the Revenue at Risk (RaR) metric. This shifts the conversation from technical debt to financial exposure. Revenue Impact is the sum of ARR affected multiplied by churn probability.
The Core Calculation: Reach x Value x Risk
Calculating RaR requires three specific variables that move beyond the developer's console. You must look at the specific segments of your user base being hindered by the defect. Use these three pillars to build your formula:
- Reach: This measures how many users or accounts are actively encountering the issue. A bug affecting 100% of your Enterprise tier is a higher priority than one affecting 5% of your Free tier.
- Account Value: This is the total Annual Recurring Revenue (ARR) or Customer Lifetime Value (CLV) of the affected segment. If a bug prevents a ₹15,00,000 account from performing a core task, the value at risk is immediate and massive.
- Risk Factor: This is the probability that the bug leads to cancellation. A broken "Export" button might have a 5% risk factor, while a data corruption bug carries a 95% risk of immediate churn.
Factoring in Support and Success Overhead
The RaR formula only covers lost revenue from customers. You must also account for the operational drain. Every unquantified bug forces your Support and Customer Success teams into damage control mode. Consider the "Support Ticket Multiplier." If a single defect generates 50 tickets, the cost of manual triage and communication can quickly exceed the cost of the actual fix. When you factor in the average cost of IT downtime, which can reach ₹7,56,000 per minute for high-traffic platforms, the need for precision becomes clear.
Integrating these metrics into a customer-driven product backlog ensures that your roadmap is built on data, not loudest-voice prioritisation. By assigning a rupee value to every ticket, you provide engineers with the clarity they need to focus on high-impact work. You can book a demo to see how automated ranking can eliminate the guesswork from your triage process and protect your ARR.
Automating the Triage: From Manual Estimates to AI-Driven Revenue Mapping
Manual bug triage is a relic of slower development cycles. In a high-growth SaaS environment, relying on a product manager to manually scan hundreds of tickets is a recipe for disaster. This approach is slow, subjective, and prone to human error. When you fail to quantify revenue impact of bugs in real-time, you risk ignoring critical defects that are actively draining your ARR. Manual spreadsheets are outdated the moment they're saved. You need a dynamic system that helps you quantify revenue impact of bugs by treating every piece of feedback as a data point in a larger financial map.
The scale of the problem is significant. Research into the economic cost of software flaws highlights that inefficient testing and triage processes contribute to billions in lost value globally. Automating this process isn't just about speed; it's about accuracy. AI-driven systems can process thousands of reports instantly, identifying patterns that a human eye would miss. This ensures that engineering resources are always deployed where they can recover the most revenue.
AI Enrichment and Automated Severity
Modern AI bug reporting tools do more than just store tickets. They actively enrich raw user data. When a customer submits a vague report, AI generates concise summaries, technical titles, and initial severity classifications. By analyzing user sentiment and behavior, the system can distinguish between a minor annoyance and a churn-inducing blocker. This automated deduplication is vital. It groups dozens of individual complaints into a single, high-priority issue, revealing the true scale of a revenue leak that might otherwise look like isolated incidents.
Bi-directional Sync and Real-Time Data
Visibility requires deep integration. Your bug tracker shouldn't be an island. It must talk to your CRM and billing systems to provide a complete picture of who is being affected. Implementing a bi-directional Jira feedback sync ensures that when a developer updates a ticket, the information flows back to the customer-facing teams instantly. This transparency allows you to close the loop automatically. Notifying a high-value account that their specific issue has been resolved is a powerful retention tool. It transforms a negative experience into a proof of your commitment to their success, effectively turning a bug fix into a loyalty-building event.
Implementing Revenue-Based Prioritisation in Your Existing Workflow
Adopting a profit-led strategy requires more than just a formula; it requires a structural shift in how your team processes data. To successfully quantify revenue impact of bugs, you must embed the calculation into your daily operations. This isn't about adding more manual work for your product managers. It's about building a pipeline that automatically translates technical issues into financial consequences. Follow these five steps to operationalise your triage:
- Step 1: Centralise. Gather every bug report, support ticket, and feature request into a single AI-triage layer to eliminate data silos.
- Step 2: Map. Connect your reporter IDs to your CRM or billing system to identify their account tier and specific ARR value instantly.
- Step 3: Calculate. Apply the Revenue Impact Formula to every incoming ticket to generate a real-time Revenue at Risk (RaR) score.
- Step 4: Route. Use automated workflows to push high-impact tickets directly into Jira or Linear, ensuring engineers see the financial weight of the task.
- Step 5: Review. Hold a weekly "Revenue Recovered" session with engineering and product leads to track progress against your recovery goals.
Integrating with Jira, Linear, and GitHub
Your developers should never have to leave their primary tools to understand business value. Effective integration means mapping the customer voice directly to engineering issues without manual data entry. Every ticket in your dev tool must include a mandatory "Revenue Impact" field. This field should sync bi-directionally, updating the RaR score as more users report the same issue. By bridging this gap, you ensure that the engineering team prioritises a ₹12,00,000 enterprise blocker over a minor aesthetic glitch. You can explore more bug tracking use cases to see how this looks in practice.
Overcoming Internal Resistance to Data-Led Triage
Prioritisation is often a political battle driven by "gut feel" or the influence of the loudest stakeholder. Shifting to a profit-first model removes this friction by providing objective evidence. When you present revenue-impact data to the C-suite for budget approval, you aren't just asking for resources to fix code; you're presenting a plan to protect ARR. This data-backed approach is the only way to quantify revenue impact of bugs for the C-suite effectively. Use internal feedback from sales and success teams to validate these revenue claims, turning your entire organisation into a unified force for growth.
Closing the Leak: Using FeedbackGraph to Visualise and Recover Revenue
Identifying the financial risk is only half the battle. You need a platform that executes the logic we've discussed. FeedbackGraph transforms your abstract bug reports into a concrete "Revenue Recovery" opportunity map. Instead of staring at a list of technical defects, you see a prioritised leaderboard of ARR that is currently at risk. This visibility allows you to quantify revenue impact of bugs with absolute precision. You can stop guessing which tickets matter and start deploying engineering resources where they generate the highest return on investment.
Efficiency starts with deduplication. Fixing the same bug three times because it was reported by three different users is a waste of capital. FeedbackGraph's AI-powered engine automatically groups similar reports into a single parent issue. This doesn't just clean up your backlog; it reveals the cumulative financial weight of a single defect. When you see that a "minor" glitch is actually affecting ₹25,00,000 worth of contracts, its priority shifts instantly. You can rank feature requests by revenue alongside your bug fixes to ensure your roadmap remains profit-led.
The FeedbackGraph AI Triage Engine
The engine handles the heavy lifting of data enrichment. It generates technical titles and assesses severity automatically, saving your product team hours of manual triage every week. Every report captured through our two-click widget includes rich metadata. Developers see exactly what the user saw at the moment of failure, which slashes the "time to fix." This streamlined flow turns raw data into actionable engineering tasks. Explore our feature set to see how we handle deep triage for high-growth teams.
Driving Growth Through Frictionless Reporting
Report volume is a leading indicator of product health. If reporting a bug is difficult, users will simply churn in silence. FeedbackGraph's seamless customer feedback widget encourages users to speak up by making the process effortless. This increased visibility helps you quantify revenue impact of bugs that would otherwise remain hidden. By closing the loop fast and notifying users of fixes, you turn frustrated customers into loyal advocates. Ready to quantify your impact? Book your FeedbackGraph demo now to secure your ARR and accelerate your growth.
Secure Your ARR with Profit-Led Triage
Engineering talent is your most expensive resource. Wasting it on low-impact edge cases isn't just a technical mistake; it's a financial one. By adopting a "Revenue at Risk" model, you align development output with measurable business growth. You now have the specific formulas and automated workflows required to quantify revenue impact of bugs, effectively turning your technical debt into a strategic asset for the C-suite.
Automation is the only way to maintain this level of visibility at scale. FeedbackGraph's AI-powered deduplication saves teams over 10 hours of manual triage every week, while our two-click widget ensures high-quality reporting directly from the source. With direct ARR-to-ticket mapping for Jira and Linear, your engineering team will always know which fix protects the most revenue.
It is time to stop letting silent churn erode your bottom line. Take control of your backlog and lead your team with the data-driven confidence that 2026 product markets demand.
Frequently Asked Questions
How do you define revenue impact for a bug?
Revenue impact is the total Annual Recurring Revenue (ARR) currently at risk due to a specific defect. It isn't just the cost of developer time but the potential loss of contract value from affected accounts. This metric accounts for both immediate churn risk and the long-term erosion of customer lifetime value. By focusing on these financial variables, teams can justify their engineering roadmap to stakeholders using profit-and-loss logic.
Can you really automate bug triage without losing accuracy?
Yes, AI-driven triage often exceeds human accuracy by removing subjective bias and processing metadata at scale. Automation allows you to quantify revenue impact of bugs by instantly cross-referencing reports with CRM data. This ensures that priority is determined by objective financial risk rather than the volume of complaints from a single, vocal user. It turns a chaotic backlog into a streamlined, data-backed recovery plan for your product team.
What is the difference between bug severity and revenue impact?
Severity is a technical measure of how much a bug breaks functionality; revenue impact is a business measure of how much that breakage costs. A critical bug in a feature used by zero paying customers has low revenue impact. Conversely, a minor aesthetic glitch that prevents an enterprise client from signing a ₹15,00,000 renewal has massive revenue impact. Technical severity informs the fix, but revenue impact determines the priority.
How does AI help in quantifying the financial cost of a software defect?
AI automates the enrichment of raw bug reports by extracting account IDs and mapping them to billing tiers. It identifies patterns across thousands of disparate reports to reveal the true reach of an issue. By calculating these variables instantly, AI provides a real-time rupee value for the cost of inaction for every ticket. This removes the guesswork and allows teams to quantify revenue impact of bugs without manual data entry.
Why is Annual Recurring Revenue (ARR) the best metric for bug prioritisation?
ARR provides a stable, long-term view of a customer's value to the business. Prioritising by ARR ensures that engineering efforts are focused on protecting the core revenue streams that sustain the company. This alignment prevents resources from being diverted to low-value support tasks that don't contribute to the overall growth or stability of the platform. It ensures that every sprint cycle is an investment in the company's financial health.
What happens if a bug affects low-value users but has high severity?
High-severity bugs for low-value users are still tracked but ranked lower on the revenue recovery roadmap. While a system crash is always urgent, profit-led triage dictates that a ₹10,00,000 account's minor blocker takes precedence over a free user's total outage. This ensures your most valuable customers receive the highest level of service and stability. It is about protecting the accounts that have the largest impact on your survival and growth.
How do integrations with Jira or Linear help in revenue recovery?
Bi-directional integrations ensure that financial data lives where developers work. By pushing Revenue at Risk scores directly into Jira or Linear, you eliminate the communication gap between product and engineering. This transparency allows developers to understand the business stakes of their tasks, leading to faster resolution of high-impact defects and direct revenue recovery. It transforms a technical ticket into a clear business objective that aligns the whole team around profit.
Is it possible to track the ROI of bug fixes over time?
You can track ROI by comparing the Revenue at Risk at the time of triage against the Revenue Recovered after the fix is deployed. This allows you to document the financial value of your engineering output in quarterly reports. It proves to the C-suite exactly how many rupees were saved through strategic prioritisation. This clear evidence justifies future budget increases for technical debt management and overall platform stability.


