

If your product roadmap is shaped by the loudest voice in the room, you're building for volume rather than value. Most product managers are stuck in a cycle of manual spreadsheet updates, trying to justify engineering spend against a backlog of "nice-to-have" requests. It's a common frustration to see high-effort features ship with zero impact on the bottom line. You need a repeatable way to quantify impact of feature requests before a single line of code is written.
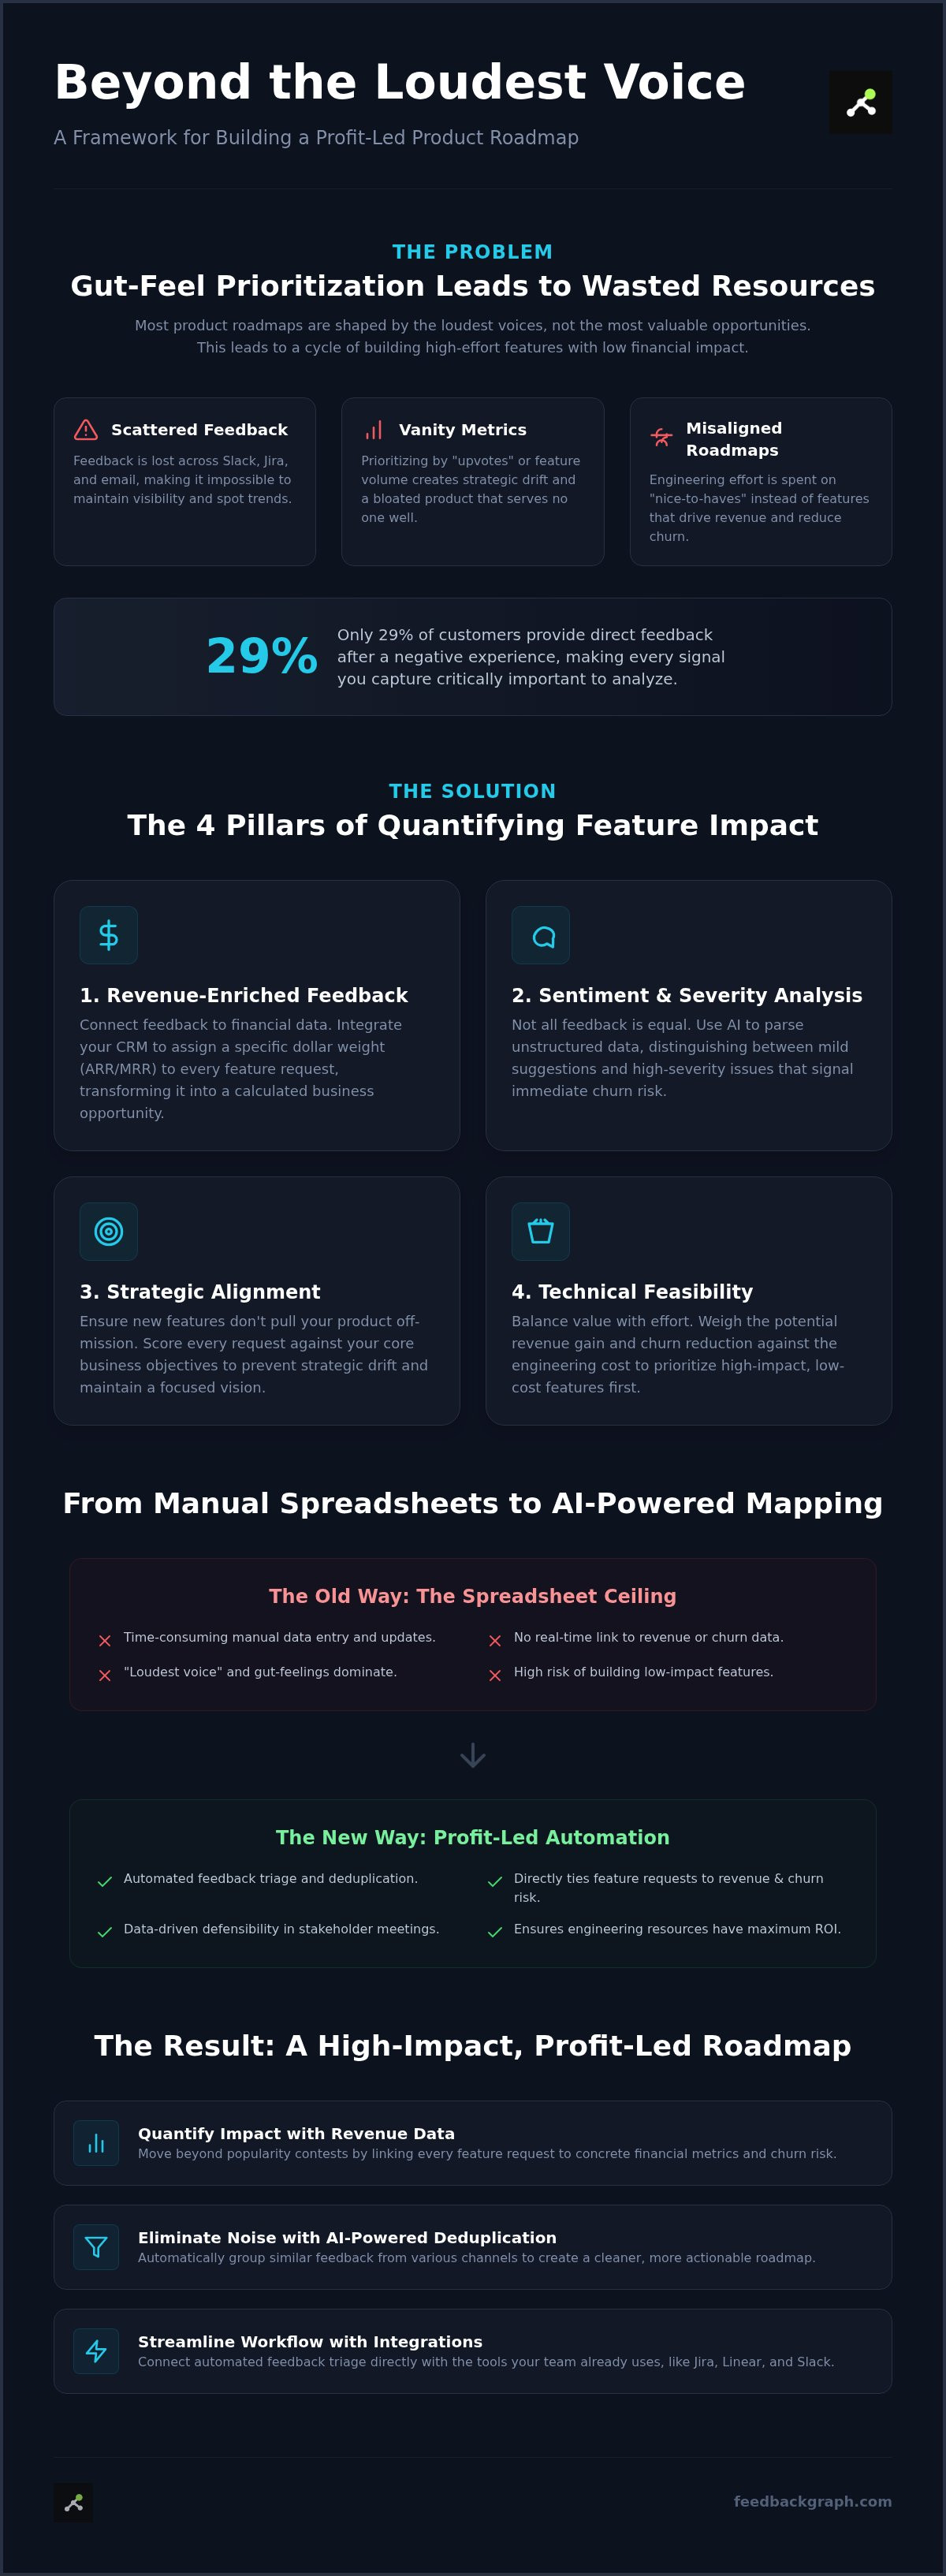
We agree that the current manual triage process is broken. It's impossible to maintain visibility when feedback is scattered across Slack, Jira, and email. This guide promises a shift from gut-feeling prioritization to a profit-led strategy. You'll learn how to map every customer request to real-world revenue and churn risk data. With only 29% of customers providing direct feedback after a negative experience according to recent 2026 data, every signal you capture must be leveraged for maximum insight.
We'll explore a framework for ranking features by financial weight, the role of AI in deduplicating signals, and how to automate the connection between customer feedback and business growth. It's time to stop guessing and start building with precision.
Key Takeaways
- Move beyond popularity contests by learning why feature volume is a vanity metric that creates strategic drift.
- Implement a data-driven framework to quantify impact of feature requests using revenue linkage and churn risk analysis.
- Break through the spreadsheet ceiling with AI-powered deduplication that automatically groups similar feedback for cleaner roadmaps.
- Streamline your workflow by integrating automated feedback triage directly with tools like Jira, Linear, and Slack.
- Build a profit-led roadmap that ensures engineering resources are always allocated to features with the highest financial ROI.
The Loudest Voice Trap: Why Feature Volume is a Vanishing Metric
Building a product based on the total number of upvotes is a dangerous game. It assumes every voice carries equal weight. In reality, a high-volume backlog often hides a lack of strategic direction. When you fail to quantify impact of feature requests, you're essentially gambling with your engineering resources. This "Loudest Voice Trap" ensures your roadmap is dictated by the most vocal users, not the most valuable ones. The result is a bloated product that loses its competitive edge by trying to please everyone at once.
The Fallacy of the Popularity Contest
Popularity is a vanity metric in SaaS. A feature requested by 10 trial users who never convert is a distraction. Conversely, a single request from a key account at risk of churning is a critical priority. You must refine your requirements analysis process to filter out the noise. We define "Feature Noise" as the delta between feedback volume and business value. High noise levels indicate a team that is listening to everyone but hearing no one. Chasing feature parity with competitors without revenue validation only accelerates this strategic drift. It forces you into a reactive cycle that ignores the specific needs of your high-value segments.
The Financial Cost of Misaligned Roadmaps
Every wasted sprint has a dollar sign attached to it. When prioritization is based on "gut feel" or internal politics, engineering morale suffers. Developers want to build software that drives growth, not "nice-to-have" widgets that sit unused in a settings menu. Subjective decision-making creates friction and erodes trust between product and engineering teams. Using data-driven defensibility allows you to quantify impact of feature requests during executive stakeholder meetings. This transparency builds trust across the organization. It ensures that every line of code aligns with high-ARR segments and expansion opportunities.
Defining "Impact" requires moving beyond a binary "yes/no" decision. You need a weighted value system that accounts for deal-breaker functionality and actual churn risk. Without this, your roadmap remains a list of suggestions rather than a strategic asset. Objective data replaces the friction of prioritization battles with clear, logical reasoning. By leveraging specific revenue-focused features, teams can pivot from reactive building to proactive growth. This shift reduces churn and maximizes the ROI of every engineering hour spent on the product lifecycle.
The 4 Pillars of Quantifying Feature Request Impact
Effective product management requires a transition from qualitative stories to quantitative data. To accurately quantify impact of feature requests, you must evaluate every submission through four distinct lenses: revenue linkage, churn risk, strategic alignment, and technical feasibility. This multi-dimensional approach prevents the team from over-indexing on a single metric, such as volume or executive preference. By weighing potential revenue against engineering effort, you ensure that high-impact, low-cost features move to the front of the queue.
Pillar 1: Revenue-Enriched Feedback
Static feedback lists are useless without financial context. You must integrate your CRM, such as Salesforce or HubSpot, directly with your feedback repository. This connection allows you to assign a specific "dollar weight" to every ticket in your backlog based on the requesting customer's ARR or MRR. This visibility transforms a simple feature request into a calculated business opportunity. It also helps identify expansion opportunities where a single new piece of functionality could unlock significant upsell potential within your existing user base.
Pillar 2: Sentiment and Severity Analysis
Not all feedback is created equal. A "curious" user asking for an integration is different from a "frustrated" enterprise admin facing a workflow blocker. Modern teams use AI to parse unstructured data and distinguish between these emotional states. High-severity bugs and deal-breaker feature gaps represent immediate churn risks that require urgent attention. Linking AI bug triage to your retention strategy ensures that you prioritize fixes for your most valuable accounts first. This is critical when you consider that 66% of CX practitioners believe customer experience is improving, while only 17% of consumers agree. Closing this perception gap requires precise sentiment analysis.
Strategic alignment ensures that even high-revenue requests don't pull the product away from its core mission. Every request should be scored against your current quarterly goals to maintain focus. Finally, technical feasibility acts as the ultimate reality check. Balancing the potential impact against engineering "t-shirt sizes" prevents the roadmap from becoming a graveyard of half-finished, complex projects. If you're ready to see how these pillars work in practice, you can schedule a personalized walkthrough of our revenue-based ranking system.
Manual Spreadsheets vs. AI-Powered Revenue Mapping
Most product teams hit the "Spreadsheet Ceiling" once they exceed 50 monthly requests. Managing feedback in a static grid is sustainable for a startup, but it quickly becomes a liability for scaling SaaS companies. Manual tracking lacks the velocity required to quantify impact of feature requests in real time. Data enters the spreadsheet, sits for weeks, and eventually decays as customer needs shift or engineering priorities change. This creates a visibility gap where the product team works on outdated assumptions rather than current market signals.
The High Cost of Manual Triage
Product managers often find themselves trapped in "feedback janitorial work." They spend hours deduplicating entries, chasing sales reps for customer details, and manually updating status columns. It's a massive drain on high-value talent. When you rely on manual input, you risk human error and inconsistent tagging. This inconsistency makes it impossible to generate reliable reports for stakeholders. You can ditch the spreadsheets for modern management to reclaim those lost hours and focus on strategic roadmap development.
The AI Advantage in Impact Scoring
AI-powered systems eliminate the manual burden by turning unstructured user quotes into clean, rankable data. Instead of reading through hundreds of Slack messages, the system uses instant de-duplication to group similar requests automatically. This ensures your volume counts are accurate and not inflated by the same request appearing in five different channels. AI also generates concise titles and summaries, allowing PMs to review impact at a glance rather than digging through raw logs.
- Automated Severity: AI classifies requests based on customer business logic and sentiment.
- Dynamic Scoring: Impact scores update automatically as new revenue data flows from your CRM.
- Bias Elimination: Data-driven mapping removes the internal politics of "who shouted loudest."
Your impact data must live where your developers work. A disconnected spreadsheet forces engineers to switch contexts, leading to friction and delayed releases. By integrating AI-driven insights directly into Jira or Linear, you create a unified source of truth. This bi-directional sync ensures that when a developer closes a ticket, the feedback loop closes for the customer simultaneously. Automation doesn't just save time; it provides the structural integrity needed to quantify impact of feature requests with absolute precision.
A 5-Step Framework to Calculate Feature ROI
Moving from a messy backlog to a high-performance roadmap requires a disciplined execution strategy. You can't effectively quantify impact of feature requests without a structured pipeline that converts raw feedback into actionable intelligence. This five-step framework provides the blueprint for building a profit-led roadmap that aligns engineering effort with business growth.
Step 1 & 2: Building the Data Foundation
Success begins with frictionless data capture. You should deploy a two-click widget directly within your application and integrate capture points into your team's Slack channels. This ensures you gather high-quality raw data at the exact moment a user feels a pain point. Once the data enters the system, you must define your "Impact Formula." This formula weights revenue, strategic fit, and urgency to create a baseline for every request.
AI triage removes human bias from the enrichment step by applying standardized logic to every request regardless of who submitted it. The system automatically assigns severity, sentiment, and strategic tags. This automated enrichment saves your product team from manual categorization while ensuring every signal receives the same objective scrutiny. You don't have to worry about internal politics skewing the priority of a specific feature anymore.
Step 3 to 5: From Data to Development
The next phase is quantification. The system links each request to the customer's financial profile, pulling ARR and plan level data from your CRM. You then apply your weighted formula: (Revenue x Strategic Fit / Effort). This calculation produces a clear rank, allowing you to quantify impact of feature requests based on actual business value. Visualizing this data on an "Impact vs. Effort" matrix makes roadmap planning sessions faster and more productive. It highlights the low-hanging fruit and the high-value strategic bets that deserve your attention.
Execution requires a bi-directional sync between your feedback platform and development tools like Jira or Linear. This connection keeps all stakeholders updated in real time. When a developer moves a ticket to "Done," the system automatically closes the loop by notifying the requesting customers. This level of transparency builds incredible trust and encourages users to provide more high-quality feedback in the future. You're no longer just building features; you're managing a high-velocity revenue engine.
Scaling Profit-Led Roadmaps with FeedbackGraph
Transitioning from a "Feature Factory" to a "Revenue Engine" requires more than just better lists. It requires a system that can quantify impact of feature requests at scale without adding administrative overhead. FeedbackGraph automates the entire quantification lifecycle, from the first user signal to the final deployment. By integrating with Jira, Linear, and GitHub, the platform creates a unified source of truth. This visibility ensures that every engineering hour is an investment in growth, not just another ticket closed in a vacuum.
The Workflow of a 2026 Product Leader
Modern product leaders don't dig through spreadsheets. They use an AI-powered dashboard to spot emerging high-impact trends before they become churn risks. This real-time visibility reduces the friction between Support, Product, and Engineering teams. When everyone sees the same revenue-linked data, prioritization battles disappear. You can explore our use cases for customer feedback to see how high-growth teams are already streamlining these internal communications.
Advanced teams leverage the MCP Server for deeper dev-tool communication. This allows for a more sophisticated data flow between your feedback repository and your technical stack. It's about building a technical ecosystem where the "why" behind a feature is always visible to the people building it. This alignment is what turns a standard development cycle into a high-velocity revenue engine. It's a pragmatic approach to transparency that builds trust across the entire organization.
Getting Started: From Backlog Noise to Strategic Clarity
Transformation doesn't require a months-long implementation. You can set up your first AI-powered capture widget in minutes. This frictionless entry point immediately starts gathering the high-quality data needed to quantify impact of feature requests. Once active, you can connect your existing Jira or Linear backlog for instant enrichment. The AI goes to work deduplicating old entries and assigning financial weight to every item in your history.
- Instant Audit: Connect your backlog to see which high-revenue requests you've been ignoring.
- Automated Triage: Let AI handle the heavy lifting of categorization and severity assignment.
- Bi-directional Sync: Keep your roadmap and your dev tools perfectly aligned without manual updates.
You move from a noisy, unmanageable backlog to a clear, strategic roadmap almost overnight. Every decision you make is backed by hard financial data and clear customer sentiment. It's time to stop guessing and start building for impact.
Start quantifying your impact today with FeedbackGraph
Master Your Roadmap with Revenue Intelligence
Stop letting the loudest voice dictate your product strategy. You've seen how volume is often just noise and why manual spreadsheets eventually fail as you scale. By adopting a data-driven framework, you can finally quantify impact of feature requests using actual revenue data and churn risk indicators. This ensures every sprint delivers measurable business value rather than just clearing out a backlog of "nice-to-have" requests.
FeedbackGraph streamlines this entire process by providing the infrastructure needed for a profit-led roadmap. You get AI-powered triage to eliminate manual work, revenue-based ranking to prioritize what matters, and bi-directional Jira/Linear sync to keep your development team aligned. It's the most pragmatic way to ensure your engineering effort directly fuels business growth and long-term retention.
Start building with precision today. You'll gain the strategic clarity required to outpace competitors and satisfy your most valuable customers. It's time to lead with data and build what actually moves the needle.
Frequently Asked Questions
How do you calculate the revenue impact of a single feature request?
Map the request directly to the customer's ARR or MRR. If five customers with a combined ARR of $50,000 request a specific feature, that total represents your baseline financial value. You should also consider potential revenue from prospects who listed that feature as a deal-breaker. This link between feedback and financial data allows you to quantify impact of feature requests with precision rather than relying on volume. It turns a simple list into a strategic financial asset.
Can I quantify the impact of bug reports as well as feature requests?
Treat bugs as retention risks rather than just technical debt. By linking AI bug triage to your CRM, you see exactly how much revenue is at risk when a high-value account reports a blocker. FeedbackGraph automates this by assigning severity and ranking bugs based on the financial weight of the reporter. This ensures your engineering team fixes high-ARR interruptions before working on minor UI polish. It's a pragmatic way to protect your existing revenue streams.
What is the best formula for prioritizing a product backlog?
Use a weighted ROI formula: (Revenue x Strategic Fit) / Engineering Effort. Revenue accounts for ARR and expansion potential, while strategic fit ensures alignment with quarterly goals. Effort is usually measured in "t-shirt sizes." This approach moves you toward a profit-led roadmap. It replaces the "loudest voice" with a logical score that justifies every development cycle. You'll find that this structured methodology reduces friction between product and engineering teams significantly by providing objective reasoning.
How does AI help in quantifying customer feedback?
AI eliminates the manual labor of feedback janitorial work. It automatically deduplicates similar requests, generates concise summaries, and assigns severity scores based on sentiment analysis. This structured data makes it possible to quantify impact of feature requests across thousands of unstructured signals from Slack and email. It ensures that every signal is enriched with context before it reaches your matrix. You move from messy spreadsheets to a streamlined, automated triage system that provides clear strategic visibility.
Do I need to integrate my CRM to see revenue impact in FeedbackGraph?
CRM integration is essential for full visibility. While you can manually tag users, connecting Salesforce or HubSpot allows the system to pull real-time ARR and plan data automatically. This bi-directional sync ensures your impact scores update as your customers grow or change plans. It provides the financial foundation required to turn your backlog from a list of ideas into a high-velocity revenue engine. Automation keeps your data fresh without the need for constant manual maintenance.
How do I handle feature requests from prospective customers vs. current ones?
Treat prospects as expansion or acquisition opportunities. Current customers represent retention and churn risk, which usually takes priority in a stable product. However, if a high-value prospect has a "deal-breaker" request, the potential ARR should be weighted against the cost of build. FeedbackGraph allows you to categorize these signals separately so you can balance acquisition goals with the needs of your existing user base. This distinction prevents you from ignoring high-value growth signals during prioritization.
What is the difference between reach and impact in product management?
Reach measures how many users a feature affects, while impact measures the depth of that effect on your business goals. A feature might reach 100% of your users but have zero impact on revenue. Conversely, a feature requested by only two enterprise accounts might have a massive financial impact if it prevents a six-figure churn. True impact quantification focuses on the business outcome rather than just the user count. It's about building value for the company, not just volume.
How do I explain my data-driven prioritization to frustrated stakeholders?
Use transparency and logic to navigate stakeholder friction. Present the "Impact vs. Effort" matrix and show exactly how revenue data influenced the current ranking. When you can prove that a requested feature has a lower ROI than a current priority, the conversation shifts from opinions to business outcomes. This evidence-based approach builds trust and ensures that everyone understands the reasoning behind every engineering investment. It transforms prioritization from an emotional battle into a collaborative, data-driven strategic exercise.


