

Every hour your engineering team spends chasing "it's not working" messages in Slack is a direct hit to your product roadmap. In an era where 41% of code is AI-generated, relying on manual reports to manage visual bug reporting for SaaS is an expensive operational bottleneck. You're likely tired of the constant back-and-forth between support and dev for every minor UI glitch. It's frustrating to watch your backlog bloat with duplicate reports while the actual state of the app during a failure remains opaque.
Modern visual tools transform these vague complaints into high-fidelity engineering data that justifies your ROI. By capturing the exact technical context at the moment of failure, you eliminate the friction that kills sprint velocity. This article explains how visual bug reporting transforms vague complaints into actionable engineering data and revenue-driven fixes. We'll explore five real-world examples of how high-performing teams use visual feedback to automate triage with AI, sync data bi-directionally with Jira or Linear, and prioritize fixes based on actual revenue impact.
Key Takeaways
- Eliminate the "Export is Broken" fallacy by replacing vague descriptions with high-fidelity data packages that include console logs and local storage state.
- See how visual bug reporting for SaaS resolves complex UI issues, such as invisible permission errors and CSS regressions, without requiring manual reproduction.
- Reduce backlog bloat by using AI-powered triage to automatically de-duplicate reports and rank fixes by their impact on account revenue.
- Accelerate time-to-resolution through bi-directional integrations with Jira and Linear, ensuring engineering data stays perfectly synced with bug reports.
- Deploy a 2-click feedback widget that automatically enriches every report with metadata, allowing developers to see the exact app state when a bug occurred.
Why Text-Only Bug Reports Are Killing SaaS Engineering Velocity
Text-only bug reports are a liability. When a user submits a ticket saying "the dashboard is blank," your engineers don't have a solution; they have a scavenger hunt. In the high-velocity world of modern software, visual bug reporting for SaaS is no longer a luxury. It's a requirement for maintaining a functional bug tracking system. A true visual report isn't just a static image. It's a comprehensive data package that captures the exact state of the application at the moment of failure. It provides the visibility required to move from guessing to fixing.
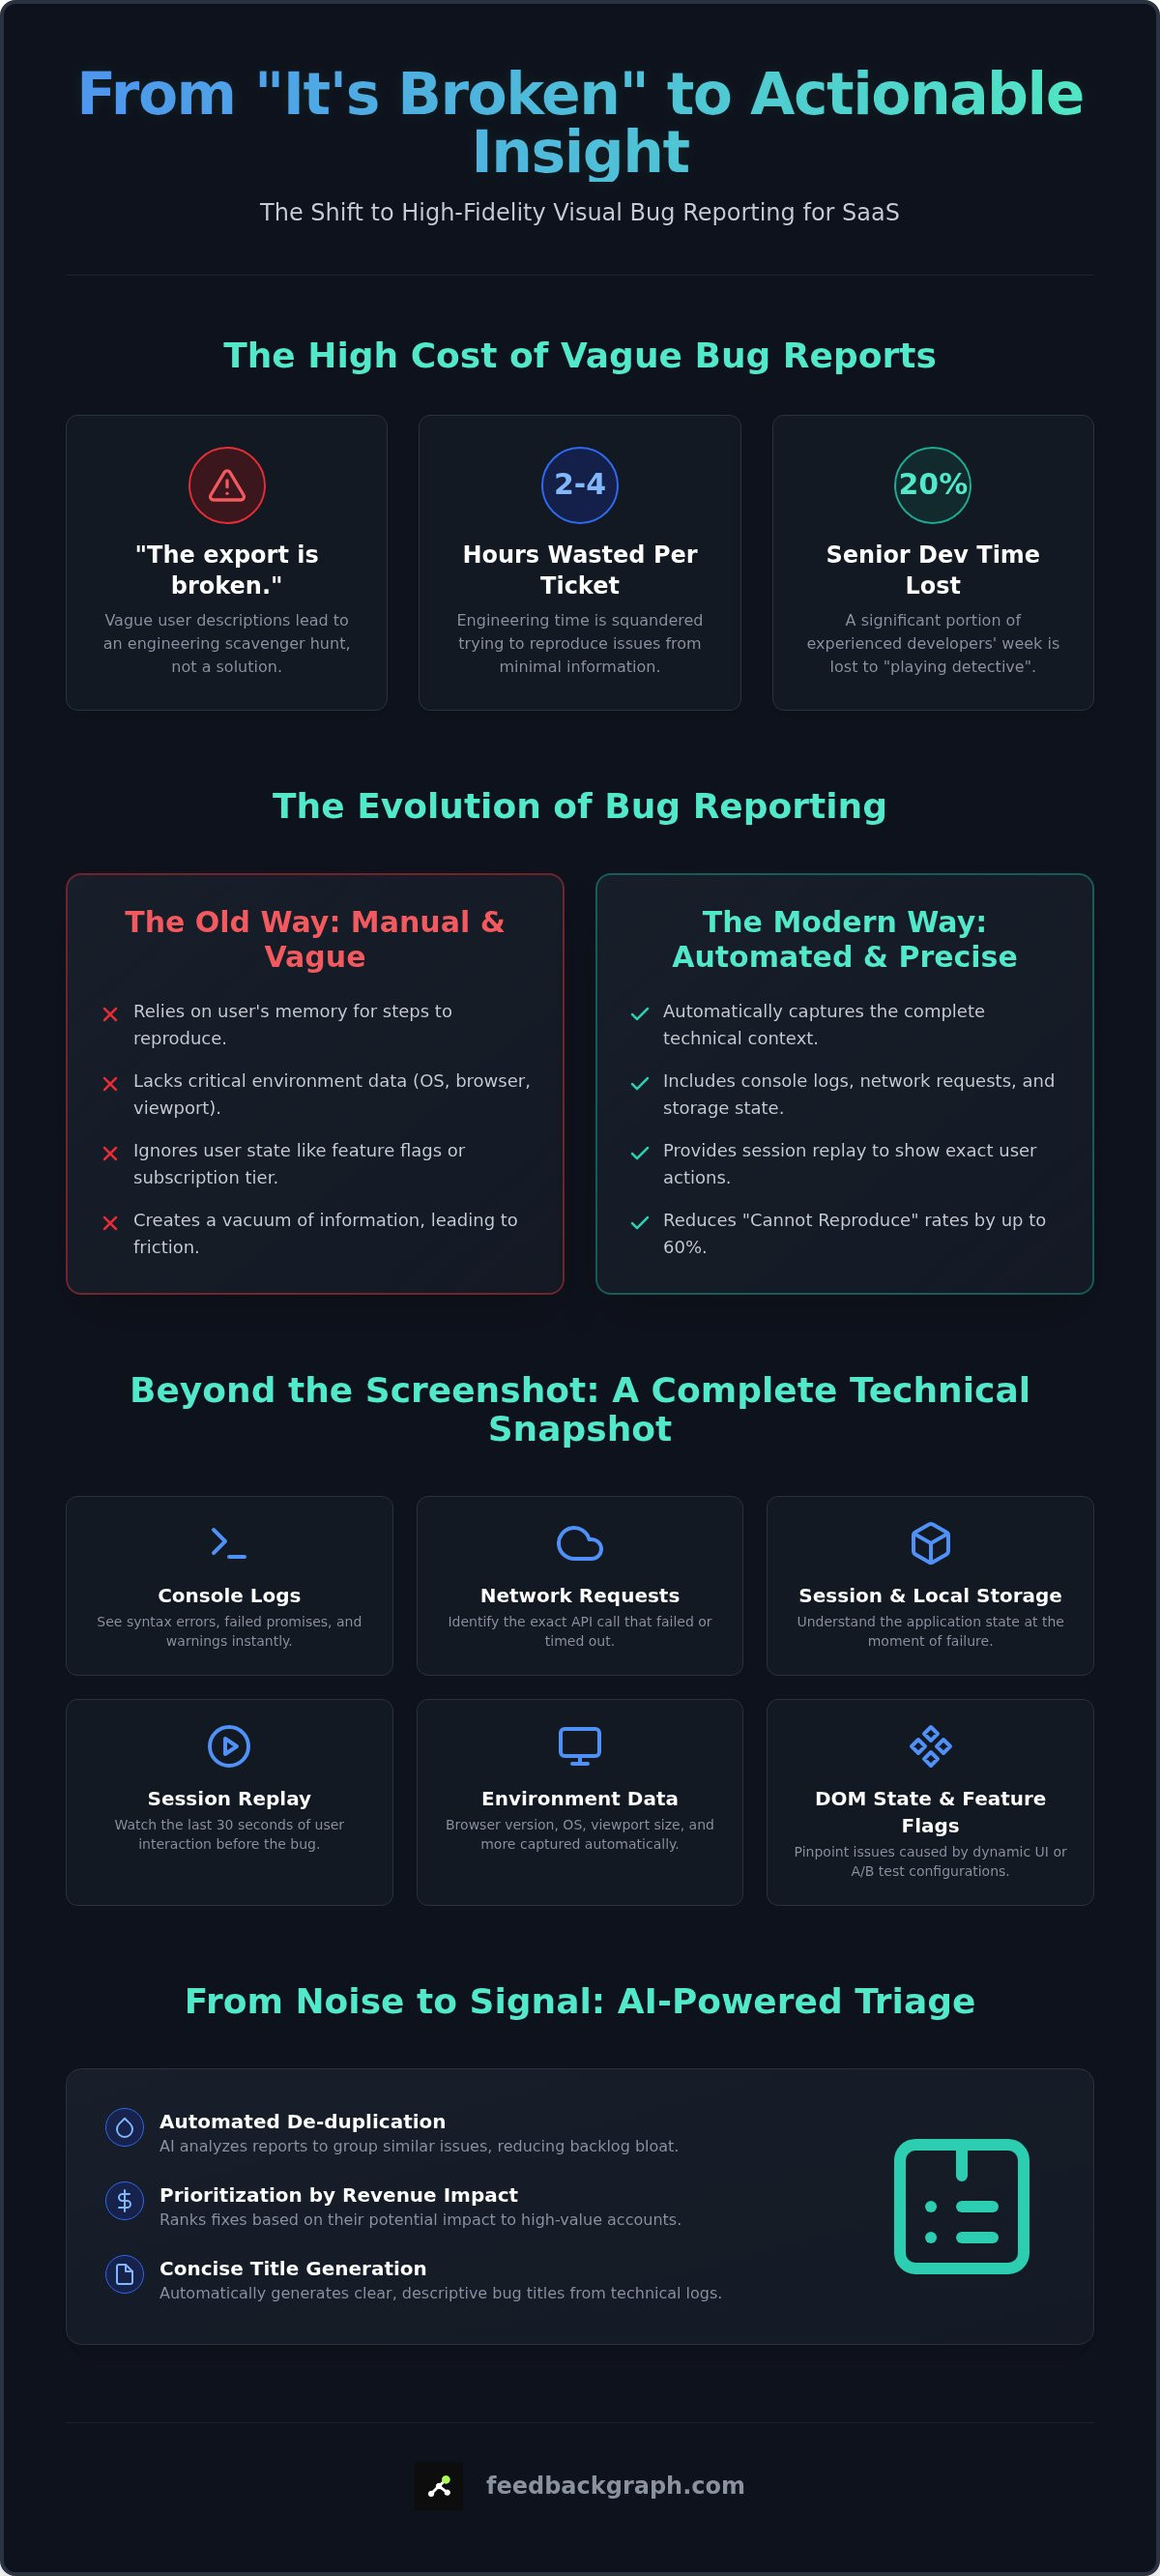
Consider the "Export is Broken" fallacy. A vague description like this typically wastes two to four hours of engineering time per ticket. Senior developers often spend 20% of their week playing detective, trying to guess which combination of browser version and user permissions caused a crash. By 2026, 95% of new digital workloads are cloud-native, creating a web of dependencies that text cannot describe. With micro-frontends and dynamic feature flags, a text description is effectively obsolete. If a micro-service fails or a flag is misconfigured, a screenshot tells you nothing about the network request that timed out or the state of the local storage.
The Anatomy of a "Bad" Bug Report
A bad report is a vacuum of information. It lacks critical environment data like viewport size, OS version, or specific browser builds. It ignores user state context, such as whether the user is on a legacy subscription tier or if a specific feature flag was toggled. Most importantly, it relies on the user's memory. When asked for "steps to reproduce," most users can't recall the exact sequence of clicks that led to the error. This gap forces engineers to guess, leading to wasted cycles, duplicate tickets, and deep frustration across the team.
The Shift to High-Fidelity Data Capture
High-performing teams are moving toward automated technical snapshots. Instead of asking users to describe a problem, visual bug reporting for SaaS captures the DOM state, network requests, and console logs automatically. This shift reduces "Cannot Reproduce" (WONTFIX) rates by 60%. It replaces the interrogation of the user with a "two-click" capture philosophy. The goal is zero friction. If reporting a bug takes more than five seconds, users won't do it. High-fidelity capture solves this by gathering data in the background while the user simply points and clicks. This ensures every report is actionable from the second it hits the queue.
The Technical Stack: What Modern Visual Bug Reporting Captures
Modern engineering teams don't need pictures; they need proof. Legacy tools stop at the screenshot, but high-fidelity visual bug reporting for SaaS captures the entire underlying technical state. This includes session storage, local storage, and the specific feature flags active during the session. If a user sees a broken UI because a feature flag was toggled incorrectly, your team needs that data immediately. Capturing these variables ensures that "works on my machine" is a phrase of the past.
You shouldn't have to ask users to open DevTools. Modern stacks mirror console logs directly into the report, allowing developers to see syntax errors, failed promises, and warning messages instantly. By capturing network requests, you identify the exact API call that returned a 404 or 500 error. Following expert tips on bug tracking involves centralizing this technical context to prevent "detective work" during triage. This level of detail moves the needle from observation to resolution within minutes.
Think of session replay as a black box recorder. It captures the 30 seconds of user interaction preceding the bug. This eliminates the "Steps to Reproduce" gap mentioned previously. You see exactly where the user clicked, how they navigated, and the precise moment the app state diverged from the expected behavior. If you want to see this technical stack in action, you can schedule a product walkthrough to witness high-fidelity capture firsthand.
The Role of AI in Data Enrichment
AI takes this raw data and makes it legible for engineers. It analyzes visual input and technical logs to generate concise, descriptive bug titles automatically. It also performs automated severity classification based on the UI state and console errors. AI-powered bug enrichment is the process of turning raw visual data into structured engineering tickets. This automation ensures that your senior devs spend less time reading logs and more time shipping fixes.
Environmental and User Context
Context is everything in a complex SaaS environment. Every report captures the exact URL, including state fragments and URL parameters that often hide the root cause of routing issues. Automated user identification links these technical snapshots to specific account tiers. This allows you to explore our visual capture features and see how they integrate with your existing user database. By linking visual bug reporting for SaaS to revenue values, you transform a technical issue into a business priority.
5 Examples of Visual Bug Reporting in High-Growth SaaS
Theory only goes so far. To understand the true impact of visual bug reporting for SaaS, you must see how it functions in high-stress production environments. High-fidelity data replaces guesswork, allowing your team to bypass the interrogation phase of support. Here are five common scenarios where technical snapshots accelerate engineering velocity.
- Example 1: The "Invisible" Permission Paradox. A user reports that a button "isn't working," but the button is actually disabled. A visual report reveals the specific permission flag in the metadata, showing that the user's account tier doesn't have access to that feature.
- Example 2: The CSS Ghost. Visual regressions often appear only on specific responsive layouts. High-fidelity capture records the exact viewport dimensions and the CSS rules applied, making it easy to spot an overflow-x issue that text could never describe.
- Example 3: The Infinite Spinner. When a dashboard hangs, the problem is usually a failed background API request. Visual reports include network logs, identifying a 504 Gateway Timeout or a malformed JSON response without requiring a local reproduction.
- Example 4: The Modal Nightmare. Overlapping UI elements often occur when multiple modals or tooltips fire simultaneously. Visual context allows engineers to see the stacking context and z-index conflicts on specific mobile viewports.
- Example 5: The Multi-Step Checkout Friction. Users often drop off during complex flows. Session replay allows product teams to see exactly where the friction occurs, such as a validation error that fails to trigger a UI notification.
Implementing visual bug reporting for SaaS ensures that these edge cases are caught with full context, preventing them from becoming recurring revenue leaks.
Scenario: The Dashboard Data Mismatch
A user submits a ticket claiming "the data is wrong" on their primary analytics chart. In a traditional workflow, an engineer might spend hours testing the UI components. However, the visual report shows an empty chart while the mirrored console logs reveal a 401 Unauthorized error. The engineer immediately identifies the issue as an expired auth token for the data service. By bypassing UI testing and going straight to the Auth service, the team achieves a 90% reduction in time-to-diagnosis.
Scenario: The "Unclickable" Save Button
In this case, the visual report includes an annotation showing an invisible overlay blocking the "Save" button. The accompanying session replay shows the user attempted to click the button 12 times, a clear case of rage clicking. Because the tool captured the DOM state, the developer sees that a legacy notification container was improperly sized and covering the interactive element. You can see more bug tracking use cases to understand how this visibility prevents user frustration and churn.
From "Broken Screen" to "Revenue Risk": AI-Driven Triage
Data capture is only the first step. If your inbox is flooded with 50 screenshots of the same homepage glitch, you've traded one manual bottleneck for another. AI-driven visual bug reporting for SaaS solves this noise problem by automatically de-duplicating incoming reports. It clusters identical UI states and console errors into a single actionable issue. This prevents your engineering leads from wasting hours manually grooming the backlog. You don't need fifty tickets for one broken button; you need one ticket with fifty data points.
Prioritization requires more than just grouping. It requires intelligent logic. By integrating your customer data, you can rank fixes based on revenue risk. A visual bug affecting a $10,000 per month enterprise account should always jump to the top of the sprint. The system analyzes the technical logs and account metadata to route issues automatically. If the report shows a CSS regression, it goes to the front-end team. If it shows a 500-level API error, it lands in the back-end queue. This ensures the right expert sees the right data immediately.
Quantifying the Impact of Every Bug
Profit-first roadmapping depends on mapping visual feedback to customer Lifetime Value (LTV). You can use FeedbackGraph to rank feature requests alongside bug reports by their potential revenue impact. This ensures your engineering resources are always allocated to the highest-value tasks. It's about visibility into what drives growth versus what just creates noise. For a deeper dive into this strategy, read our guide on how to quantify the revenue impact of every bug. This approach turns your bug tracker into a strategic growth tool.
Bi-directional Integration with Jira and Linear
Information silos kill engineering velocity. High-fidelity visual bug reporting for SaaS thrives on bi-directional integration with tools like Jira and Linear. When a user submits feedback, the system creates a ticket with all technical evidence attached automatically. As developers move the ticket through the SDLC, the status syncs back to the user-facing widget. This closes the communication loop without manual support intervention. You can check our technical documentation for integrations to see how to configure these workflows for your specific stack.
Implementing Visual Bug Reporting with FeedbackGraph
Implementation shouldn't be a project; it should be a configuration. Adding the FeedbackGraph widget to your application takes less than two minutes. Once live, you configure the AI Triage Dashboard to process incoming data based on your specific engineering priorities. This is where the visual bug reporting for SaaS strategy becomes operational. You link your existing stack, such as Jira or Linear, to enable bi-directional sync. This ensures that every high-fidelity report captured by the widget flows directly into your development workflow without manual entry.
Best practices dictate a clear separation between internal and external reporting. For production environments, the widget remains a zero-friction channel for users to report glitches. Internally, your team can use the same infrastructure to document staging issues or QA regressions. This dual-use approach centralizes all visual evidence into a single source of truth, preventing the fragmentation of bug data across different tools and spreadsheets. By centralizing this data, you ensure that senior engineers spend their time on architectural progress rather than ticket grooming.
The Workflow for Product Teams
Product teams gain the most from "Internal Feedback" mode during staging and QA cycles. This mode allows developers to capture edge cases with full technical context before they reach production. It eliminates the need for manual documentation by automatically attaching logs and DOM snapshots to every report. To manage the customer side, the system uses AI-generated status replies. These updates keep users informed about the progress of their reported issues, reducing the burden on your support team. You can explore specific use cases for internal feedback teams to see how this streamlines the pre-release process.
The Future of AI-Driven Feedback
The landscape of software development is shifting toward agentic engineering. FeedbackGraph leverages MCP servers to allow AI agents to interact with your feedback data directly. This means your AI-assisted development tools can analyze visual reports and suggest code fixes autonomously. This evolution transforms visual bug reporting for SaaS from a reactive triage process into a proactive driver of revenue growth. By 2026, 88.3% of organizations will use AI-assisted tools daily. Integrating your feedback loop with these agents ensures your team stays ahead of the curve. For a broader look at this shift, read our analysis on Bug Reporting Software in 2026: AI-Driven Revenue Growth.
Move Beyond Manual Triage
Every minute your team spends deciphering vague bug reports is a minute lost to product innovation. High-fidelity visual bug reporting for SaaS isn't just a convenience. It's a strategic layer that converts raw user frustration into structured engineering data. By capturing the full technical state, you eliminate the back-and-forth that stalls progress. You've seen how the right context can reduce diagnosis time by 90% and move your roadmap forward with precision.
Leveraging AI-powered deduplication ensures your backlog remains lean and actionable. When you combine this with revenue-based ranking and bi-directional sync for Jira and Linear, your triage process becomes autonomous. You aren't just fixing glitches; you're protecting your enterprise accounts and optimizing for growth. It's time to replace manual detective work with high-fidelity visibility and automated triage.
Build a culture of speed where every report is a solution in waiting. Your engineering team deserves the clarity of high-fidelity data.
Frequently Asked Questions
What is visual bug reporting for SaaS, and how does it differ from standard feedback?
Visual bug reporting for SaaS is a high-fidelity data capture process that combines screenshots with real-time technical metadata. Unlike standard feedback, which relies on vague user descriptions, this method automatically attaches console logs, network requests, and environment details. It transforms a subjective complaint into an actionable engineering ticket, eliminating the need for manual reproduction or follow-up questions about browser versions and operating systems.
Will adding a visual bug reporting widget slow down my application’s performance?
No, modern widgets are designed to be extremely lightweight and load asynchronously. They don't block the main thread or interfere with your application's core logic. Data capture only triggers during specific events, such as a user click or a console error. This ensures your app’s performance remains optimized for the end user while still gathering critical diagnostic information in the background without latency.
Can visual bug reporting tools capture console logs and network errors?
Yes, high-fidelity platforms capture mirrored console logs and network requests automatically. This allows developers to see exact syntax errors, failed API calls, and timeout messages without ever asking the user to open their browser's DevTools. By centralizing these logs within the bug report, you provide the engineering team with the evidence needed to diagnose front-end crashes and back-end connectivity issues immediately.
How does AI help in triaging visual bug reports for engineering teams?
AI automates the most time-consuming parts of the triage process by de-duplicating identical reports and generating descriptive titles. It analyzes the visual state and technical logs to classify severity levels automatically. This ensures your backlog stays clean and actionable. Engineering leads can then focus on resolution rather than manual ticket grooming or identifying which reports are duplicates of existing issues.
Is visual bug reporting secure for SaaS apps handling sensitive user data?
Security is a core component of professional reporting tools. These platforms include features for PII masking and data redaction to ensure sensitive user information never leaves the client’s browser. By using secure, encrypted storage and adhering to industry standards, visual bug reporting for SaaS provides a safe environment for capturing technical data without compromising user privacy or violating compliance requirements like GDPR.
How do I integrate visual bug reports directly into Jira or Linear?
You can establish a bi-directional sync through native integrations that connect your reporting widget to Jira or Linear. This setup creates a ticket automatically whenever a user submits feedback, attaching all visual and technical evidence. Status updates are mirrored across both platforms. This ensures your support team and users are notified instantly when a developer moves a fix into production.
Can visual bug reporting help prioritize feature requests based on revenue?
Yes, by linking reports to user metadata, you can rank incoming feedback based on account revenue or lifetime value. This allows product teams to prioritize fixes and feature requests that affect high-value enterprise accounts first. It shifts the focus from a first-come, first-served model to a profit-first roadmapping strategy. This ensures your engineering resources generate the highest possible ROI for the business.
What is the difference between a screenshot tool and a contextual bug reporting platform?
A screenshot tool provides a flat image that lacks technical context, often requiring hours of manual investigation to reproduce the error. A contextual visual bug reporting for SaaS platform captures the entire application state, including the DOM, local storage, and session replay. This high-fidelity data package gives engineers everything they need to fix the bug without guessing, whereas a simple screenshot only shows the symptom.


